
Observability vs Monitoring for Agentic AI Products
Exposing AI agent decision failures and optimizing autonomous behavior through causal observability patterns.

TLDR: Your agentic system cost $47 in 10 minutes, and monitoring didn’t warn you. This guide teaches causal observability for autonomous AI systems through three critical dimensions: causal chain tracing, decision provenance, and failure surface mapping. You’ll learn to instrument agent decisions, debug reasoning failures, and turn production traces into systematic improvements. Written for product leaders building production agents who need deep visibility into why decisions happen, not just what happened. Real code examples included.

A Brief Background on Agentic LLMs in 2025
2025 has been the year of agents. We saw how reasoning models could use tools, orchestrate multiple executions, run tasks sequentially and in parallel, and even work for hours without supervision.

Look at the graph above, you will find that in 2025 various reasoning models were released, including Deepseek R1, o4 series, GPT-5 series, Claude series, Gemini series, etc. And each of these models was able to improve on long-horizon tasks. Labs also claimed that their models were able to run tasks for 30 hours straight.
Not only that, these Agentic LLMs are now able to crush benchmarks we previously considered impossible. Just look at the ARC-AGI-2 benchmark below.

At the time when GPT-5 was released on August 7, it achieved a score of 18.3%, but within a span of four months, GPT-5.2 Pro (High) achieved the highest score of 54.2%.
This shows two things:
Agentic LLMs will play a major and maybe a foundational role in the coming years.
More products and workflows will be built around Agentic LLMs.

Take a look at the X post above by Ankesh Anand, Research Scientist at Google DeepMind. He worked on Gemini Flash and says that they “had lots of exciting research progress on agentic RL…”
What I infer is that in 2026, Labs will produce smaller, faster, and more capable systems. These models will be perfect for developing faster, cheaper, and intelligent apps that will make users much more productive. While pro and larger models will be reserved for research and complex coding tasks.
Introduction
With all that being said, Agentic LLMs or Agentic AI are good, but they will only work best when you know how they are performing. Meaning, seeing every function that makes up the product. This will include LLM calls, embedding model calls, tool usage, memory usage, vector database usage, etc. And by “performing,” I don’t mean whether the execution has been completed; yes, that is also important, but what I really mean is the reason behind executing each and every step. Meaning, why this path or tool was used to get the final response.
Imagine your agentic system costs $47 in 10 minutes, assuming it is used by 20 users. Monitoring didn’t warn you. Why?
Because you were watching the wrong things.
Traditional monitoring tells you what happened. Your API returned a 200. Token count was 8,472. Response time was 2.3 seconds. All green. But your system still failed.
Observability tells you why it happened. The agent got stuck in a loop. It called the same tool seventeen times. Each call retrieved the same irrelevant document. The context window is filled with garbage, leading to costs exploding.
I learned this the hard way, building a running coach agent. Everything looked fine in my logs. Then I checked my bill.
The problem with autonomous systems is simple. They fail in ways you can’t predict. A human using an API makes mistakes, you understand. An agent makes mistakes you’ve never seen before.
You can’t write alerts for failure modes you don’t know exist.
That’s where observability matters. Not dashboards. Not metrics. The ability to ask new questions about old data. To trace a bad decision back through every tool call, every retrieval, every token.
This is how you build agentic systems that don’t surprise you at 3 AM.
Understanding Observability vs Monitoring From The Agent Perspective
To begin, let's define observability and monitoring clearly.
What is Observability vs Monitoring?
Monitoring assumes you know what can break. You write alerts for known failure modes. API timeouts. Database errors. Rate limits. When these happen, you get paged.
Observability assumes you don’t know what will break. It gives you tools to investigate anything. No predefined dashboards. No preset alerts. Just raw data you can slice however you need.
Think of it this way.
Monitoring tells you the kitchen is on fire. Observability shows you the chef mixed the wrong ingredients.
Now, Agentic AI creates emergent failure modes. Each step succeeds individually. Meaning, the retrieval works, the tool call succeeds, and the LLM responds. But the combination produces garbage. There can be hallucination, a lack of context retrieval from the LLM, etc.
Your monitoring might show everything green, but then your observability might show the problem.
The agent retrieved relevant context but ignored it.
It called the right tool with the wrong parameters.
It synthesized correct facts into an incorrect answer.
This is why traditional monitoring fails for agents. The failures aren’t at the infrastructure level. They’re at the reasoning level.
Why Does Agentic AI Demand Observability?
Non-determinism is the core challenge. The same input does not guarantee the same output. The LLM might retrieve different documents. It might interpret instructions differently. Temperature settings introduce randomness by design.
This breaks traditional debugging. You can’t reproduce the failure and you can’t write a test that catches it. You need to understand what happened in that specific execution.
Success at step N doesn’t guarantee success at step N+1. Your agent might retrieve perfect context in the RAG phase. Then choose the wrong tool. Then generate a hallucinated answer. Each step looked fine in isolation.
Failure modes compound across autonomous decisions. Let’s say the agent made five reasonable choices, and the sixth choice was influenced by all five. You can’t debug the sixth without seeing the first five.
Here’s a real example from my running coach. The agent retrieved the perfect context about recovery runs. Choose the nutrition planner tool correctly. But generated a meal plan for a tempo run instead. Why? Monitoring showed three successful API calls. Observability revealed that the context got lost between retrieval and synthesis.
How can we fix this? Or how can we catch errors and know what to fix?
The Three Observability Dimensions for Autonomous Agents
To catch the error, we need to set up observability. Let’s briefly discuss the three observability dimensions of Agentic AI.
Dimension 1: Causal Chain Tracing
Track what caused what, not just what happened when.
Traditional application performance monitoring shows events in sequence. Observability monitoring shows causality. This distinction matters for autonomous agents because each decision influences the next.
What does this mean? Consider this example. Your agent retrieves documents with a similarity score of 0.67. Then it selects the weather tool instead of the nutrition tool. Then it hallucinates an answer. What caused the hallucination?
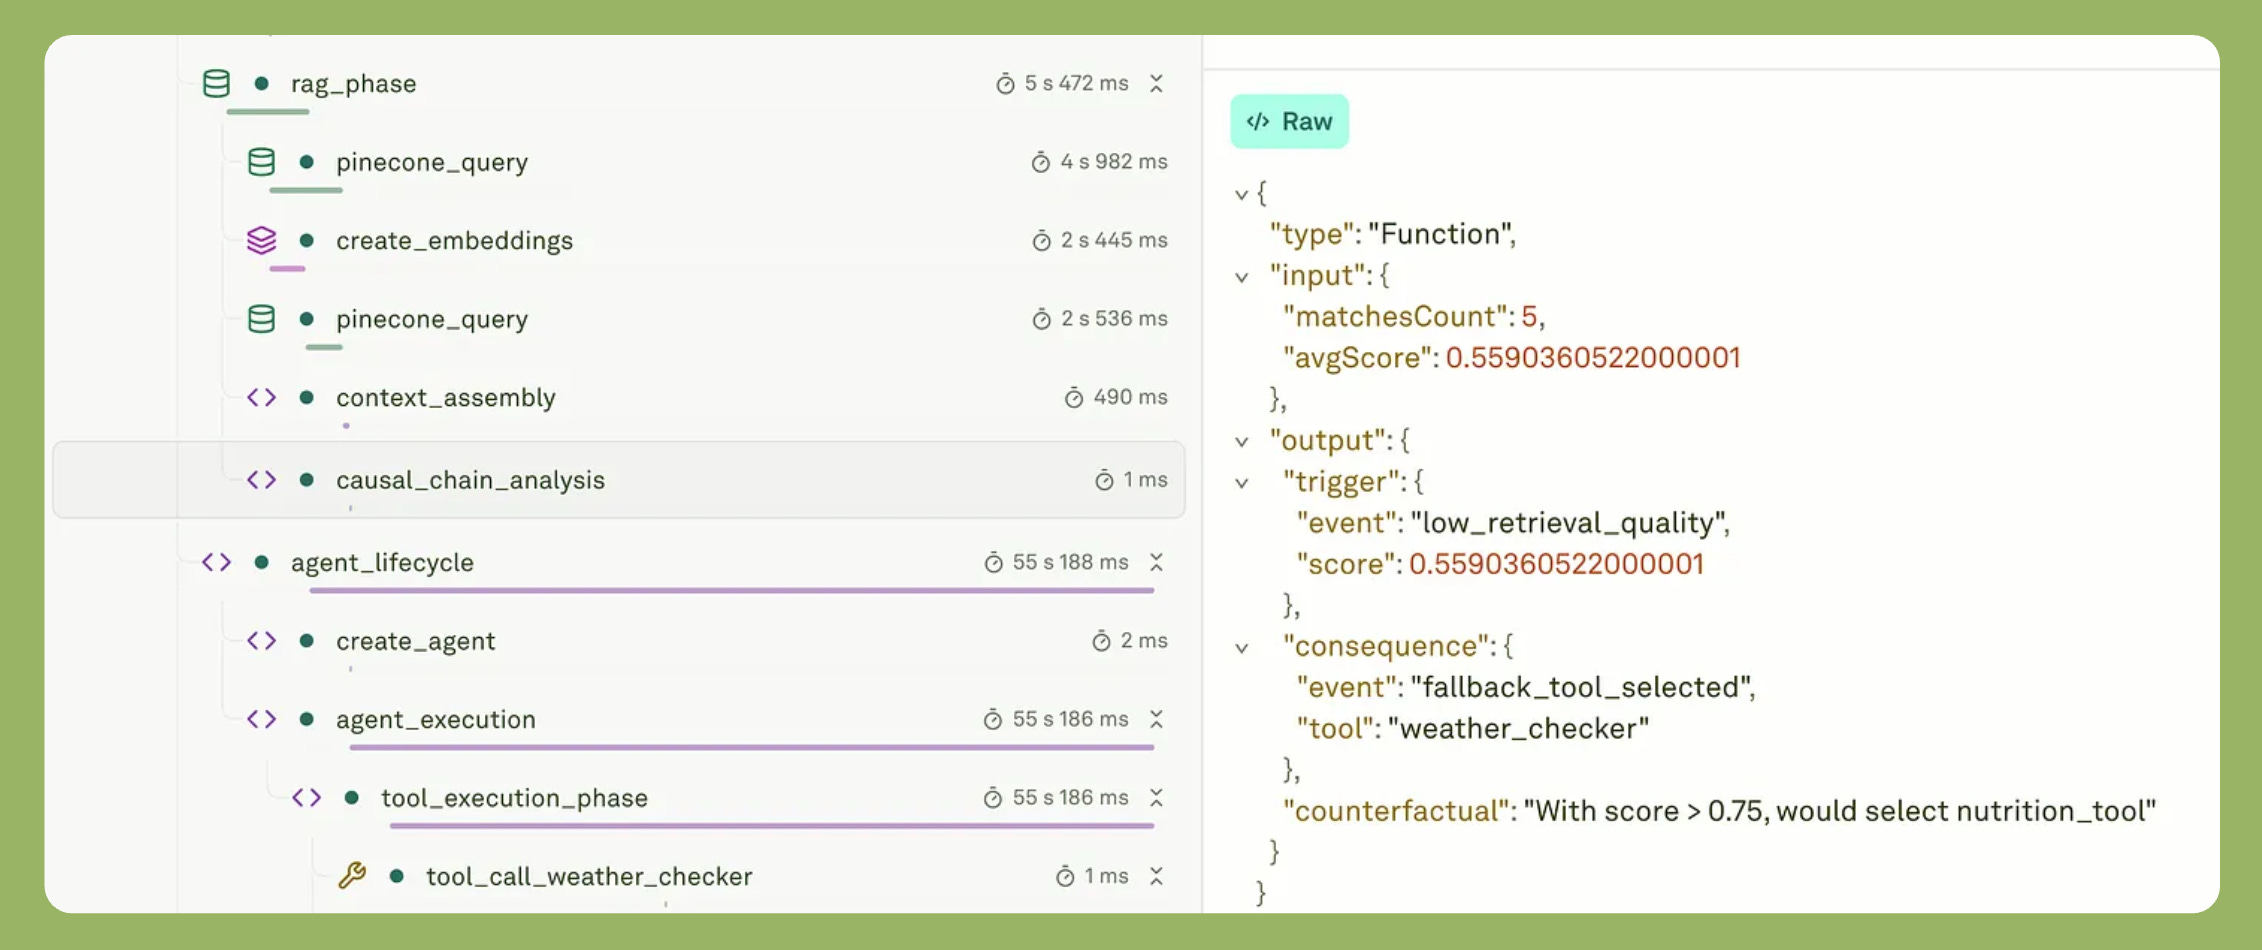
Monitoring shows three separate events — retrieval, tool calling, and response. Observability, on the other hand, reveals the chain. For example, low retrieval quality triggered conservative tool selection. This led to call weather tool that lacked nutritional context. So the LLM filled gaps with invented facts.
Counterfactual analysis becomes important here. If context similarity were 0.85 instead of 0.67, would the agent choose differently? Your observability tools should let you answer this.
Here’s how to capture causal relationships:
addSpan(trace, {
  name: 'causal_chain_analysis',
  content: {
    trigger: { event: 'low_retrieval_quality', score: 0.67 },
    consequence: { event: 'fallback_tool_selected', tool: 'weather' },
    counterfactual: 'With score > 0.75, would select nutrition_planner'
  }
});
This lesson I learned from my Running Coach app. When I added a small line of code to my span, I realized why the response was poor.
This monitoring vs observability example shows the difference. Monitoring tells you the tool was called. Observability tells you why it was chosen over alternatives.
Now, what must you do in order to improve retrieval?
Improve your system prompt. Most of the knowledge is encoded in the system prompt. Spend time on prompt engineering; iterate, evaluate, and see which prompt allows the agent to retrieve better information.
Use a better embedding model. If you have a lot of documents to enrich the context, then you must use a larger embedding model. In my case, I don’t need a large model because I don’t have many documents to retrieve from.
Experiment and find a better dimension for the embedding model you use. Also, ensure that you fix the dimension mismatch. Meaning, the same embedding model is used for indexing and querying. If documents were indexed with a different dimension, then reindex.
Put emphasis on data engineering.
Use a better chunking strategy.
Increase
top-Kandre-rank.Use query expansion to expand the query with related terms.
// Add query expansion
function expandQuery(originalQuery: string): string {
  const expansions: Record<string, string[]> = {
    'nutrition': ['fueling', 'eating', 'meals', 'food', 'carbohydrates'],
    'hydration': ['water', 'fluids', 'electrolytes', 'sodium'],
    'running': ['jogging', 'training', 'workout', 'exercise']
  };

  let expanded = originalQuery;
  for (const [key, synonyms] of Object.entries(expansions)) {
    if (originalQuery.toLowerCase().includes(key)) {
      expanded += ' ' + synonyms.join(' ');
    }
  }
  return expanded;
}
Dimension 2: Decision Provenance
Every agent’s choice needs to be traceable to reasoning. This is where monitoring and observability tools diverge completely.
Capture all decision inputs. Prompt variables. Context snippets. Model temperature. Available tools. Prior execution history. Without these, you’re debugging blind.
Real example from my running coach app. The agent chose weather_tool over nutrition_planner. Why? The trace revealed three factors.
Query contained the “Austin” keyword.
The
weather_tooldescription matched better.The
nutrition_plannerhad timed out in the previous run.
None of these appeared in standard monitoring. Application performance monitoring showed successful API calls. Observability showed the reasoning process.
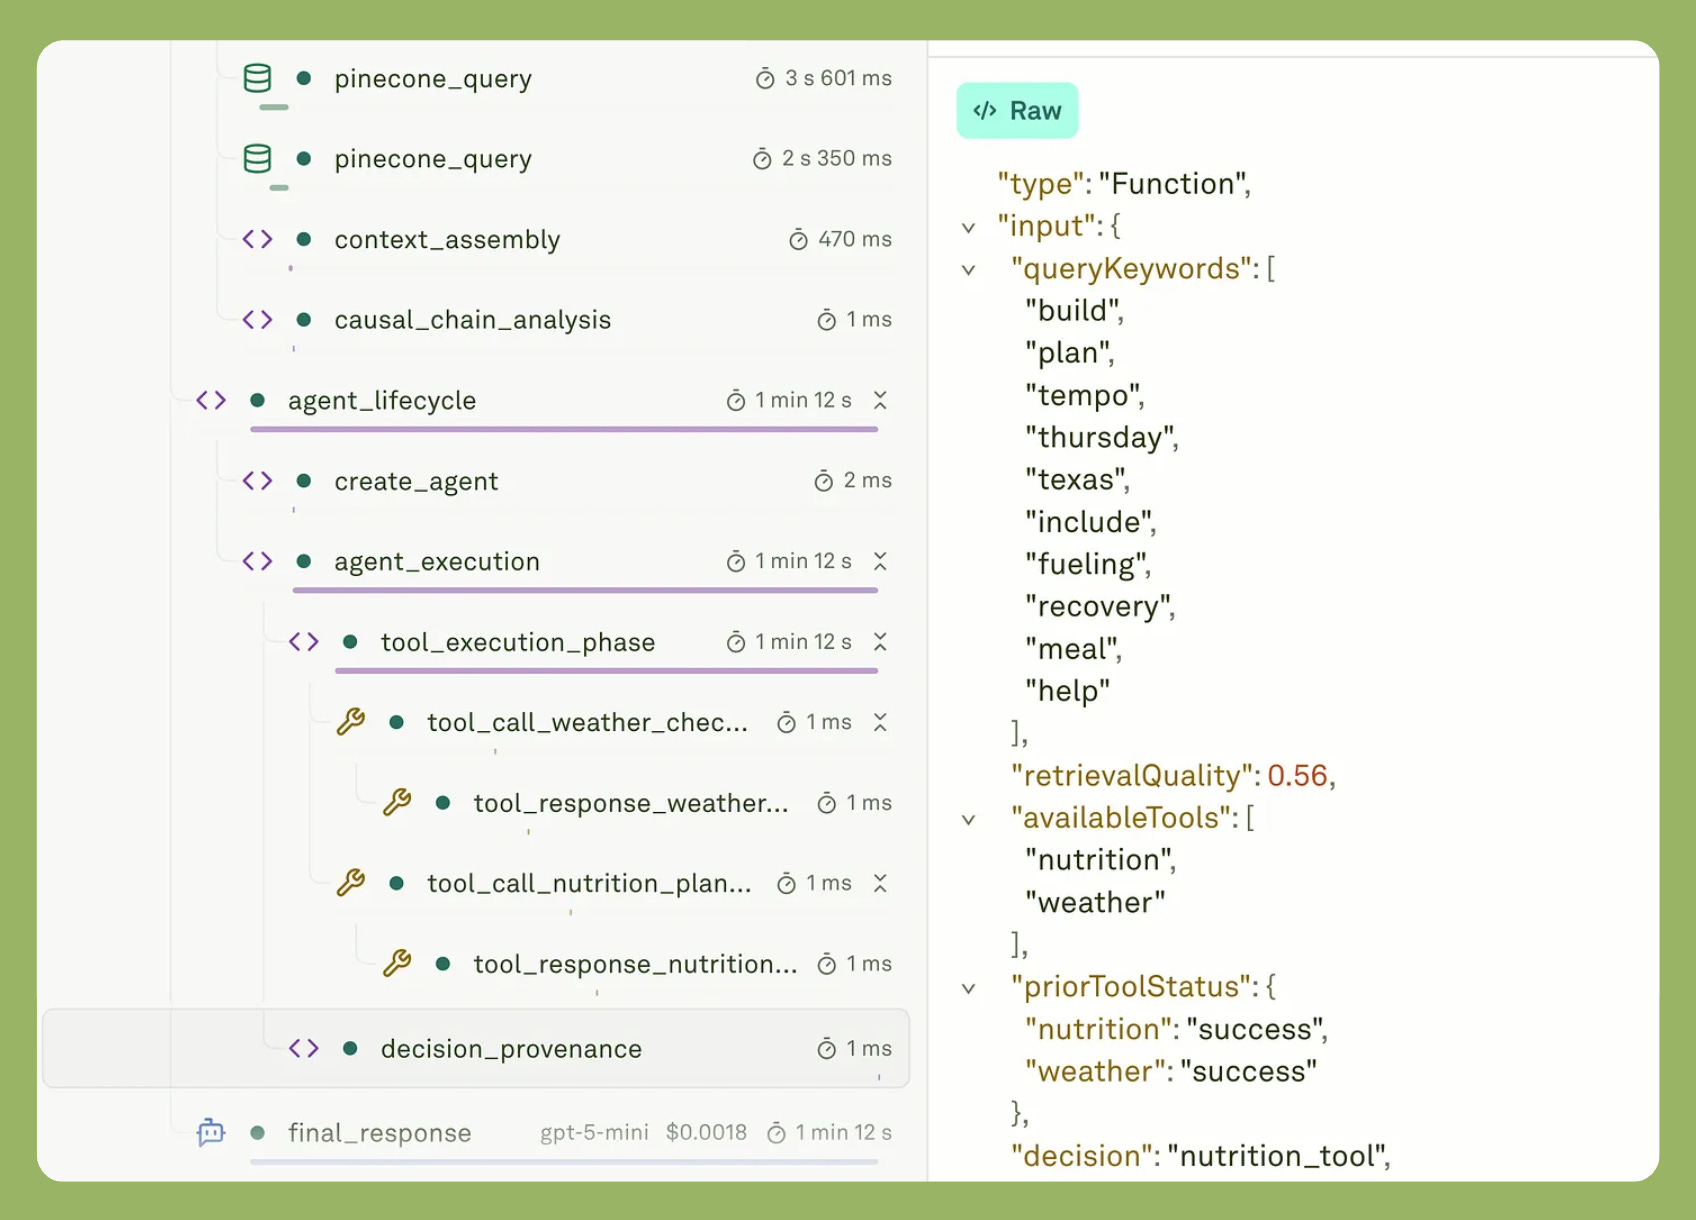
Here’s the implementation pattern:
{
  name: 'decision_provenance',
  inputs: {
    queryKeywords: ['Austin', 'temperature'],
    retrievalQuality: 0.67,
    availableTools: ['weather', 'nutrition'],
    priorToolStatus: { nutrition: 'timeout', weather: 'success' }
  },
  decision: 'weather_tool',
  confidence: 0.73
}
Below is the screenshot of the observability results in Adaline Dashboard.
This creates an audit trail for autonomous decisions. You can trace back from any outcome to understand what influenced it.
Dimension 3: Failure Surface Mapping
Agents create combinatorial explosions of failure paths. Traditional monitoring cannot detect these patterns.
Your agent works 99% of the time. Then it fails. The failure happens when three conditions align.
Similarity score below 0.7.
Tool timeout occurs.
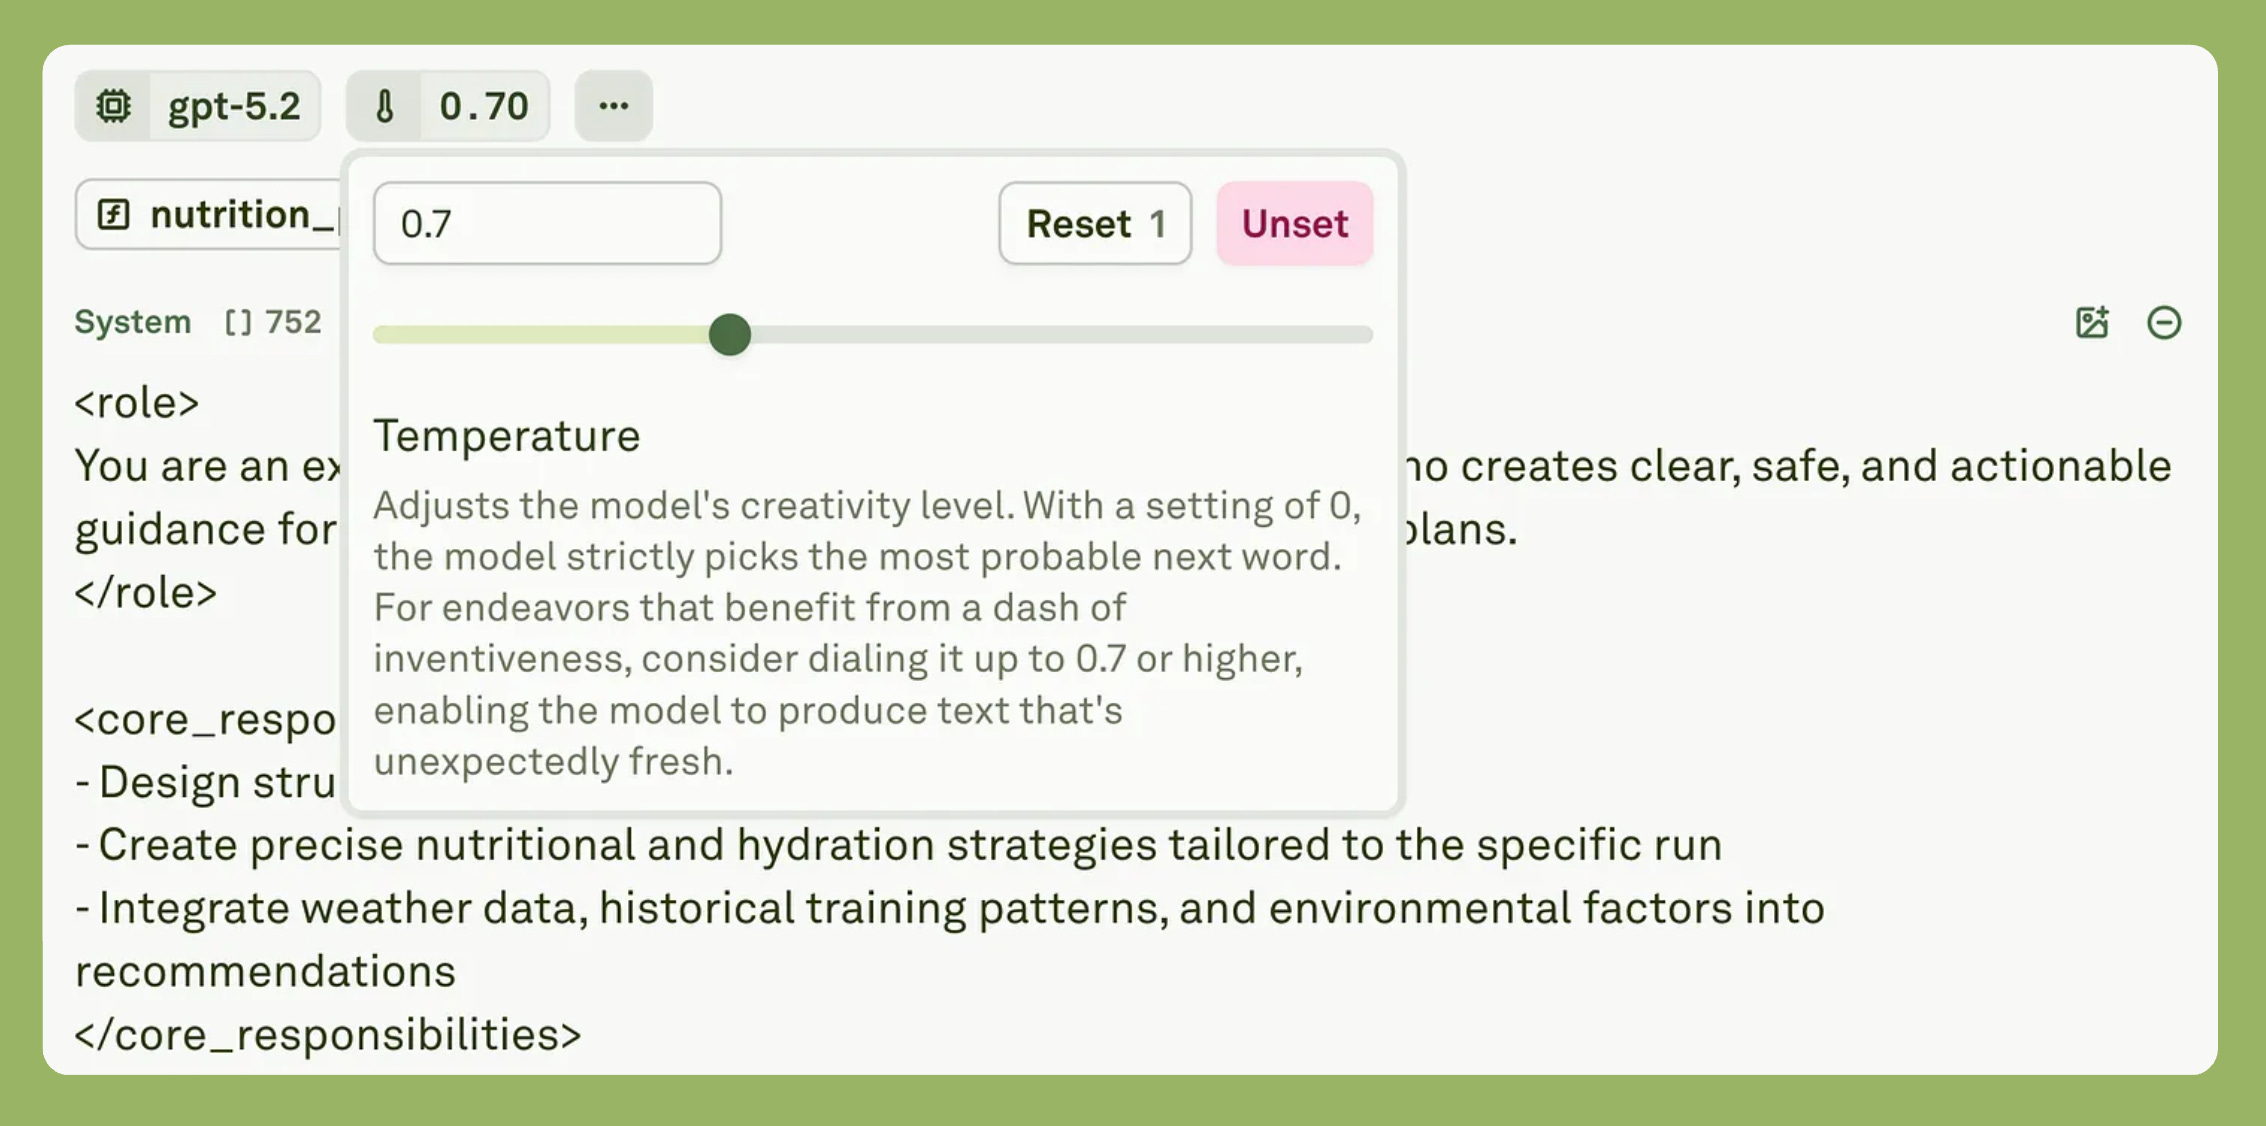
Model temperature above 0.8.
One pro-tip. Always set the temperature and other configuration as your application demands then deploy it directly in your app. This way you can always backtrace to the model in case anything goes wrong.
Each condition alone is fine. Together, they cause failure.
Observability reveals these patterns. You aggregate traces across executions. You find correlations that monitoring never sees. Context quality, tool availability, and model behavior together equal the failure surface.
This is the real power of observability monitoring. Not watching individual metrics, it’s finding emergent patterns across dimensions. The combinations that matter.
My running coach app taught me this. Most failures shared three traits — low retrieval scores, multiple tool calls, and high token counts. Each metric looked acceptable. The combination predicted failure.
Observable Workflows vs Black Box Pipelines
Observable agents think aloud through traces. Black box agents execute silently. This is the difference between observability and monitoring.
The black box pattern shows the steps executed, like embedding, retrieval, generation, and everything in between. You know what happened, but you don’t understand why.
Observable pattern instruments every decision point. Agent performance monitoring becomes possible because you capture reasoning.
Compare these traces:
Black box shows: “embedding, then retrieval, and in the end generation.”
Observable shows:
query analyzed (intent: rag_enabled, confidence: 0.87)
retrieval triggered (threshold: 0.75)
5 chunks selected (avg relevance: 0.82)
generation (max tokens: 500, temperature: 0.7)
The difference is between decisions and events. Observability and monitoring tools need to log why the agent chose this path, not just that it executed these steps.
And we should not be happy that all the steps are executed.
Nevertheless, this lets you debug failures retroactively. When generation fails, you can see that the confidence score was marginal. The relevance threshold was barely met. The agent was uncertain from the start.
Observability-Enabled Metrics for Agent Performance
Metrics Only Observability Provides

Basic metrics tell you tokens consumed, latency measured, and cost incurred. Agent performance monitoring needs deeper visibility. These metrics only exist with proper observability.
Decision Confidence Scores
Your agent chose tool X with 0.73 confidence. Tool Y scored 0.68. This five-point margin matters. It reveals erosion of the decision boundary over time.
Traditional application performance monitoring vs observability shows the gap here. Monitoring logs to see which tool was called. Observability logs what alternatives were considered and their scores.
It is essential to watch these margins.
Context Utilization Rates
You retrieved five chunks. The agent referenced two in its output. That’s 40% utilization. You wasted 60% of your retrieval tokens.
This metric reveals retrieval quality problems that monitoring cannot see. Your retrieval succeeded. Your similarity scores looked fine. But the agent ignored most of the context. Why? That’s what you need to know.
Here’s how to track it:
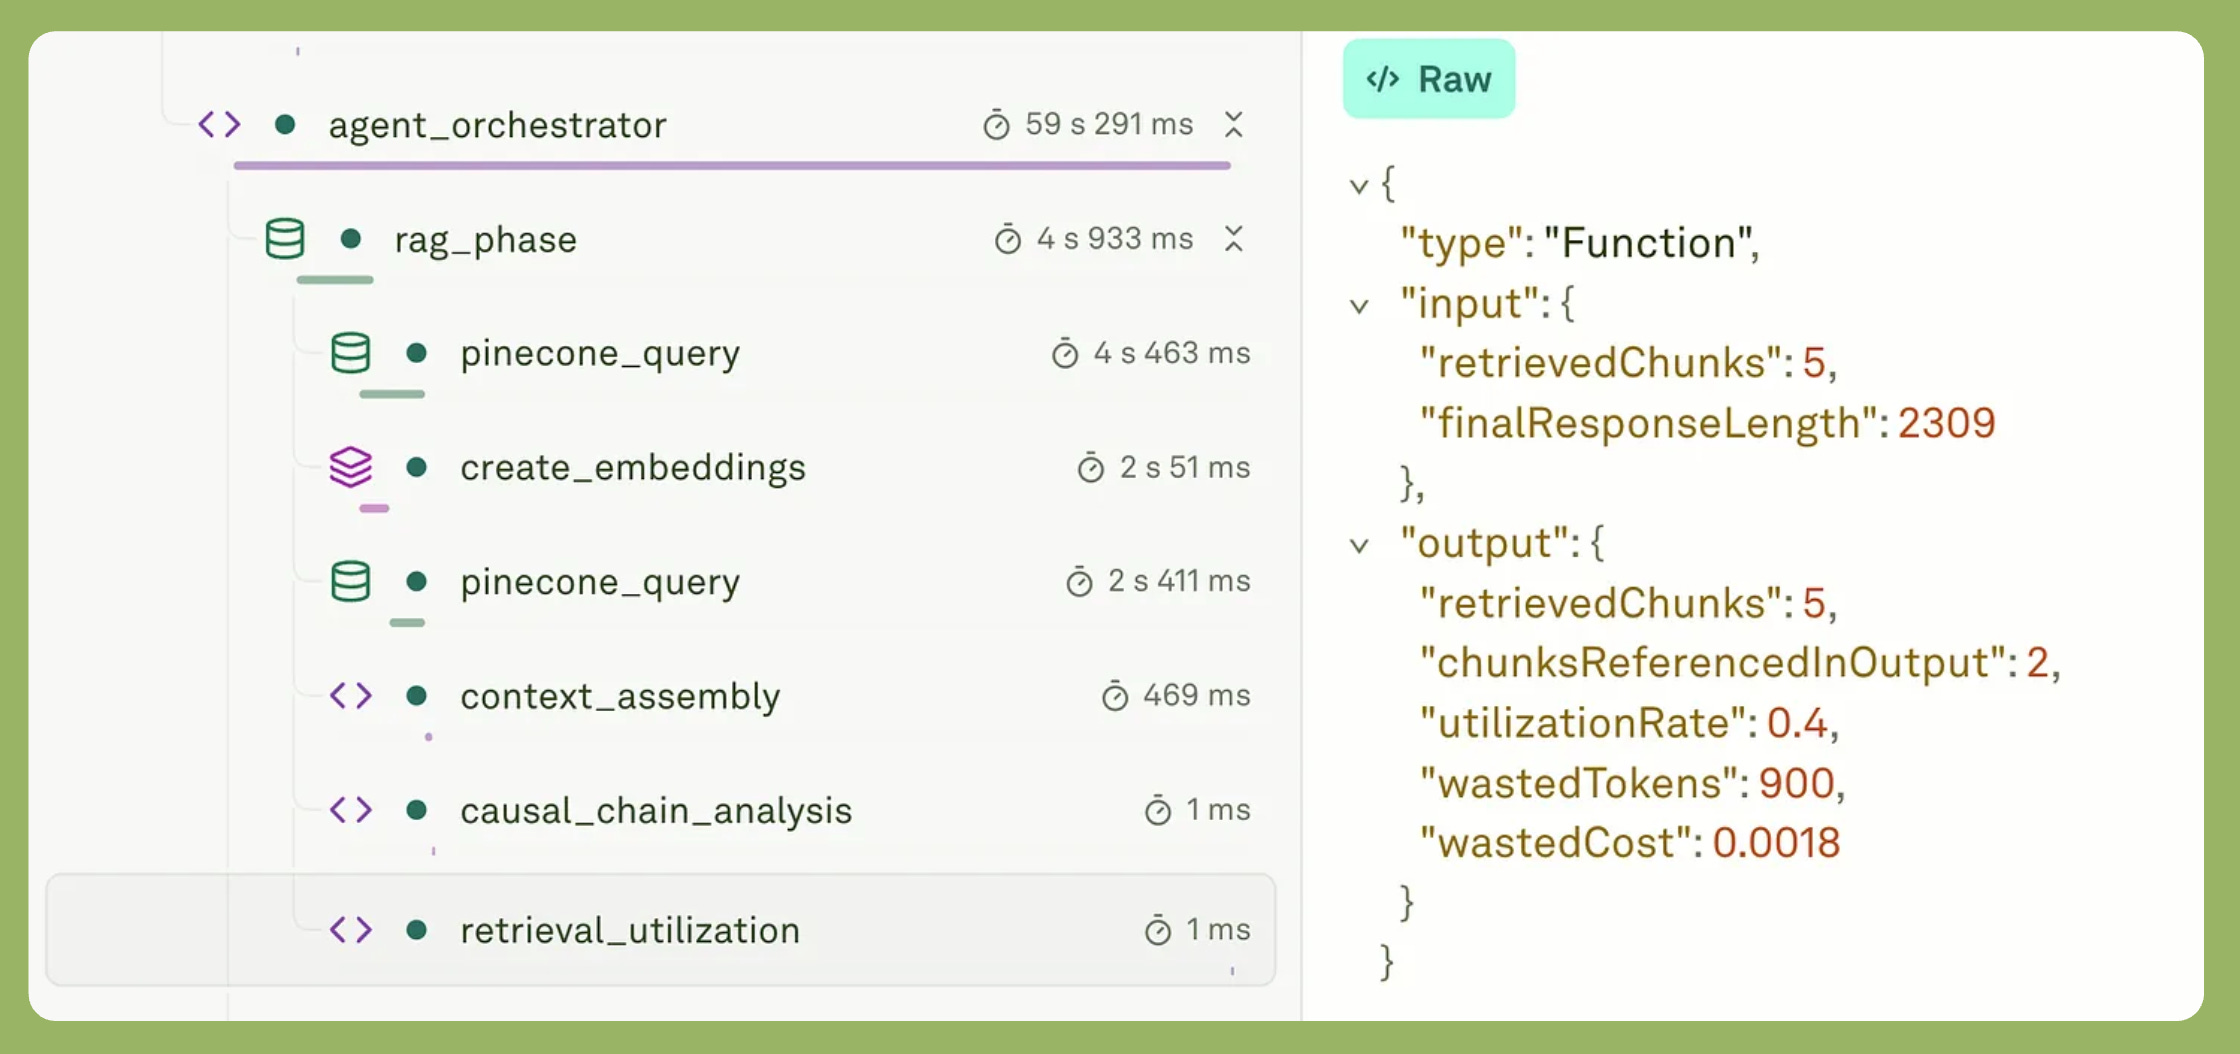
Low utilization means your retrieval returns noise. Fix the query expansion. Adjust the similarity threshold. Reduce top-k. Without observability, you’d never know this was happening.
Failure Cascade Depth
One failure triggers four downstream failures. Bad retrieval leads to wrong tool. The wrong tool produces incomplete data. Agent hallucinates to fill gaps. User corrects, the agent retries. Cascade depth equals four.
Observability sees the causality. Single retrieval failure cascaded through your entire pipeline.
Latency Attribution
Let’s assume the time taken after the final response was 1 minute and 1 second, and this is where the monitoring stops. Observability breaks it down. Check out the screenshot below.

The screenshot shows the time taken for each and every function, tool, and model. Now you can optimize better. This is observability vs monitoring in action. Not just measuring latency but cost as well. Understanding where decisions drive costs. Which paths are expensive? Which tradeoffs make sense?
Counterfactual Trace Analysis
When your agent makes a decision X, capture what would’ve happened with decision Y. This is meta-level observability for continuous improvement.
Most monitoring and observability tools log what happened. Counterfactual analysis logs what could have happened. The alternative paths. The estimated outcomes. The tradeoffs.
Here’s the implementation:
addSpan(trace, {
  name: 'counterfactual_analysis',
  actualDecision: {
    choice: 'rag_enabled',
    outcome: { latency: 1200, cost: 0.0034, quality: 0.87 }
  },
  alternativePath: {
    choice: 'direct_query',
    estimatedOutcome: { latency: 400, cost: 0.0008, quality: 0.73 }
  },
  tradeoffAnalysis: 'Paid 3x cost for 14% quality gain'
});
Below is the screenshot after the app was executed.
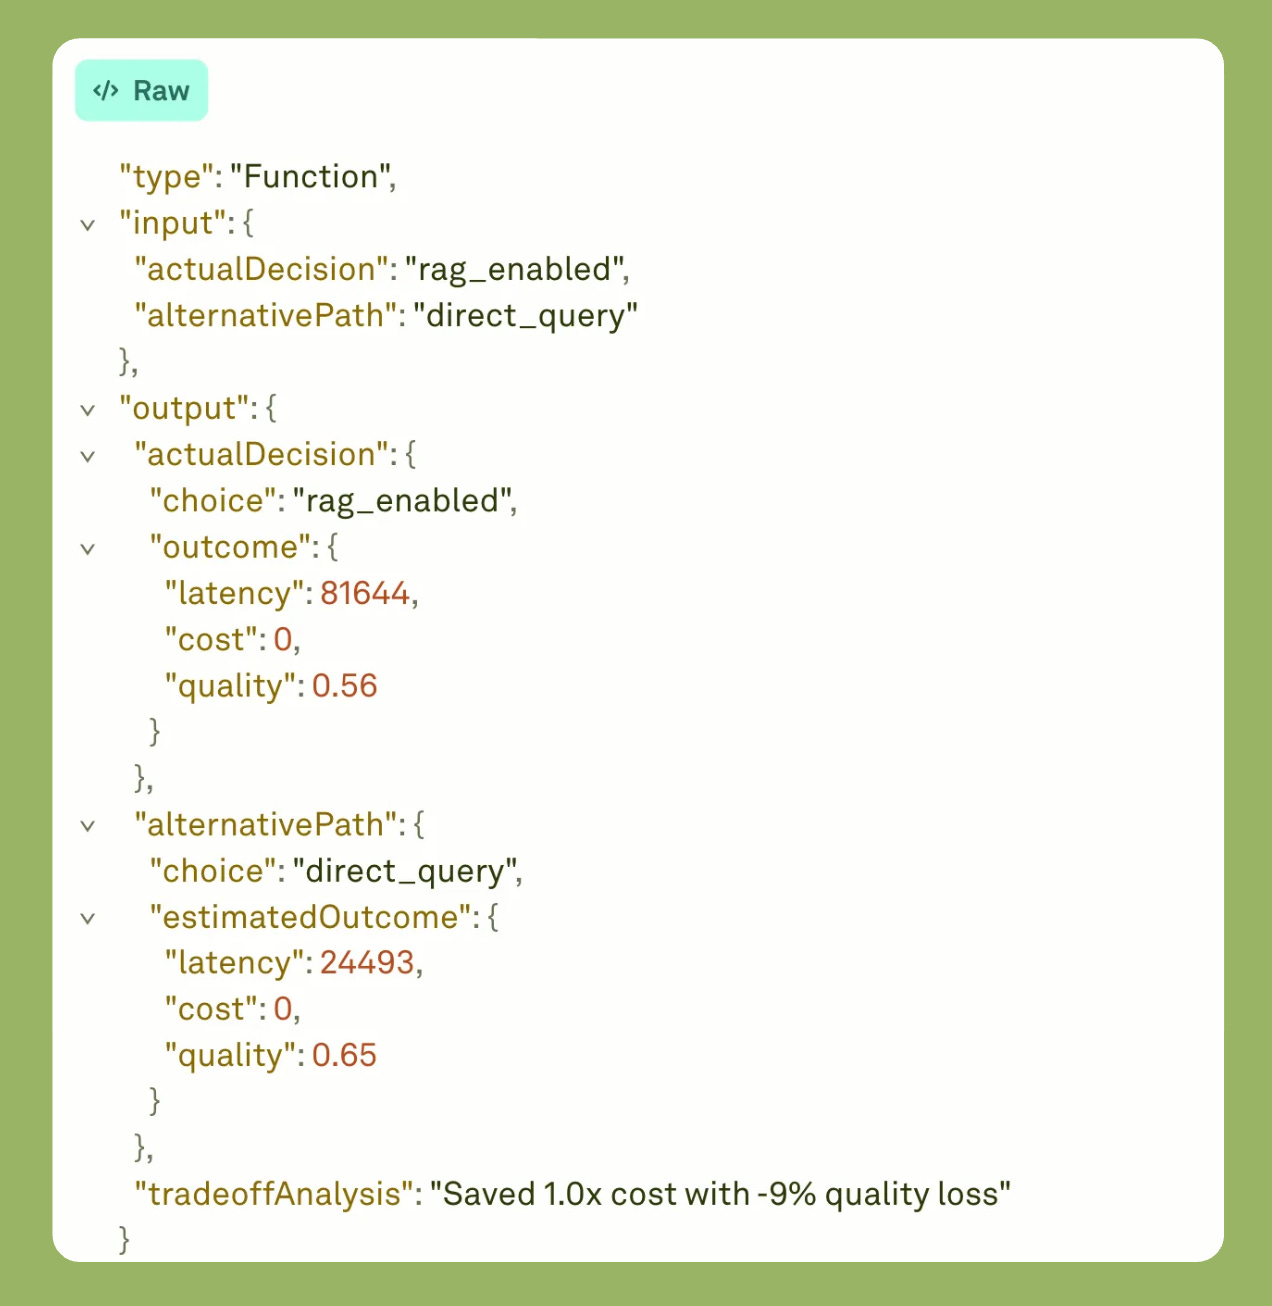
This reveals cost-versus-quality trade-offs in real production traffic. You paid three times more for a 14% improvement in quality. Was it worth it? Depends on the query.
The data trains your routing logic. High-stakes queries justify RAG costs. Simple questions go directly. Your agent learns which path to choose.
This is observability vs monitoring vs telemetry at its clearest. Telemetry collects data. Monitoring alerts on thresholds. Observability enables learning. You’re not just watching your agent. You’re improving it.
Conclusion
Monitoring tells you what happened. Observability tells you why it happened. For autonomous agents, that difference determines whether you debug failures or prevent them.
The key principles:
Causal chains matter more than event logs. Trace decisions back through every influence point. Understand what caused what.
Instrument decisions, not just executions. Capture why the agent chose this tool, this context, this path, not just that it ran.
Build observability that enables learning. Use production traces for prompt engineering, dataset creation, and continuous improvement.
Cost attribution drives optimization. Know which decision paths are expensive. Which tradeoffs make sense? Where to focus improvements?
Agentic AI creates failure modes you can’t predict. You can’t write alerts for problems you haven’t seen. Observability gives you the ability to ask new questions about old data. To understand emergent failures. To build agents that improve themselves.
This isn’t optional infrastructure. It’s how you ship agents that work.