
Why Observability Is Non-Negotiable for Multi-Provider RAG Systems
How traces and spans help you catch failures, control costs, and scale confidently across OpenAI, Anthropic, and specialized vector stores


When you are developing an AI product, you need a much narrower approach than a generalist approach. A narrower approach is much more aligned to your product’s vision, the problem that you are solving, and the ICP that you are targeting. A generalist approach is where you make an app or a product for a wide spectrum of users. They cater to users across domains and backgrounds, in contrast to a narrower approach that serves only a small group.
Now, an AI product has different layers. And the core layer is the AI layer, which consists of a foundation model. A foundation model is a pretrained model that is trained on the world data. It also undergoes additional training phases so that it is aligned with human safety. But these foundation models are [again] general models and they need to be narrowed down to domain-specific knowledge and aligned with product vision. To do that, you need techniques that tame the model in the right direction. One of which is prompting, and others are incorporating techniques like RAG, tool calling, web search, etc.
This blog specifically focuses RAG-based systems and how monitoring such system is important. We will discuss the importance of a trace and spans of such a system and also touch upon Adaline Gateway that provides a unified solution for calling models from multiple model providers.
The Multi-Provider RAG Challenge
Modern products that use RAGs rely heavily on embedding models and vector databases. These components allow you to store information in vectorized form, making retrieval faster and storage more efficient when a user sends a query.
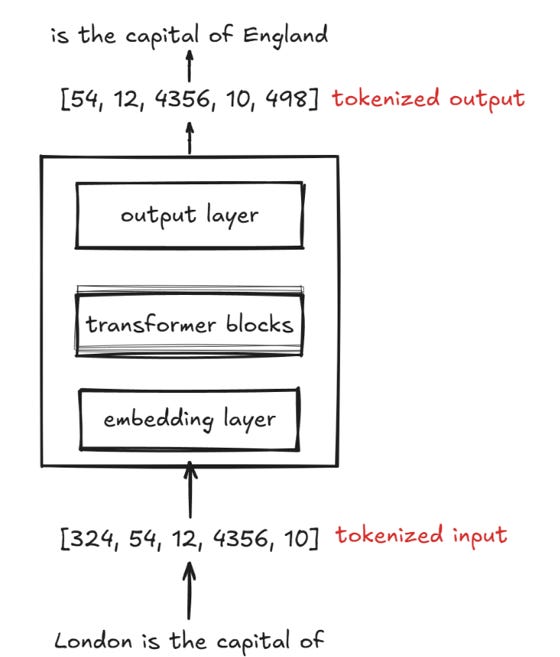
Embedding models play a major role, as they represent a word token as a vector. This is the entire process:
The given documents, like PDFs, docs, markdown, etc., are broken as tokens. Tokens are essentially a broken-down version of a word. Not all words are broken down into smaller words or subwords, but most of them are. For example: “understanding” can be broken down into “under”, “stand”, and “ing.”
Then each token is given a token ID. Meaning, the words now are represented as numbers or integers. The numbers are uniquely assigned to each token.
Lastly, the token ID is sent to the embedding models, where they are converted to vectors.
Remember, vectors have both direction and magnitude. That is the core functionality of vector embeddings. A vector can have different dimensions. These dimensions represent semantic patterns: the direction in the vector encodes the relationship, while the magnitude of the vector encodes the strength of the relationship.
Now, another key thing to remember is cosine similarity. It is a metric to measure how close two vectors point toward each other, helping systems determine which pieces of text are most relevant to a user’s query.
But the story doesn’t end with embeddings and storage alone. One of the most crucial parts of a modern RAG stack is the ability to operate across multiple providers without losing visibility.
Today’s RAG apps often mix best-of-breed tools: OpenAI embeddings for dense vectors, Anthropic or Claude for deeper reasoning, and specialized vector stores for search like Pinecone or Chroma. Each provider brings its own API and SDK, response shapes, rate-limit rules, and cost structures. This diversity gives you better performance but adds friction when something breaks.
A malformed embedding, a timeout from a reasoning model, or a spike in token usage can quietly degrade the entire system. And without proper observability, you are prone to error.
Without observability, you can miss the root cause. You don’t see how upstream failures can stack into poor retrieval or irrelevant answers.
That’s why observability becomes a first-class requirement in RAG systems. It lets you trace the path from query to embedding to retrieval to generation and fix issues before they reach the user.
Let’s look at a simple example from the Running Coach App.
The app uses OpenAI’s embedding model [“text-embedding-3-small”] to generate dense vectors for each user query. But instead of calling OpenAI directly, the system routes everything through the Adaline Gateway, which standardizes requests, responses, errors, and cost tracking across providers.
// We use OpenAI for embeddings
const model = openai.embeddingModel({
  modelName: ‘text-embedding-3-small’,
  apiKey: OPENAI_API_KEY
});

// Adaline Gateway handles the provider abstraction
const resp = await gateway.getEmbeddings({
  model,
  config,
  embeddingRequests: { modality: ‘text’, requests: batch }
});
Notice how the model itself comes from OpenAI, but the call goes through the Adaline Gateway. This becomes essential once you introduce Anthropic for completions, or Pinecone for retrieval, because each provider has its own SDK conventions, error shapes, and performance quirks. The Gateway absorbs that complexity, while observability traces help you see exactly where failures originate and how they impact the final answer.
Building Trace-First RAG with Adaline
A RAG system or a RAG-based product will work efficiently if it does these two things:
All the components must work smoothly.
All the components work under a given constraint. Meaning, the embedding and response costs, along with latency and other factors, are within a set limit.
That’s why this design treats every operation as a span. Each embedding call. Each retrieval. Each model completion. Even the prompt augmentation before the query leaves the system.
All of them leave a trace.
A span records each and every of the smallest details in a given component. For instance, latency, token usage, token cost, etc. It stores the inputs, the outputs, and the relationships between the parts. Also, the meta data.
And all these spans roll up into a single trace, which shows the full flowchart of a user request from the moment it enters the system to the moment it leaves.
The Running Coach App begins by creating a trace. It sets a name. It sets a unique reference. It marks the start time. And it adds small attributes that help describe the environment.
export function createTrace(name: string, projectId?: string): Trace {
  return {
    name,
    status: ‘success’,
    startedAt: Date.now(),
    referenceId: uuidv4(),
    spans: [],
    projectId,
    sessionId: uuidv4(),
    attributes: {
      app_name: ‘The Running Coach App (RAG)’,
      runtime: ‘node’,
      language: ‘ts’,
    },
    tags: [’running-coach’, ‘rag’, ‘pipeline’],
  };
}
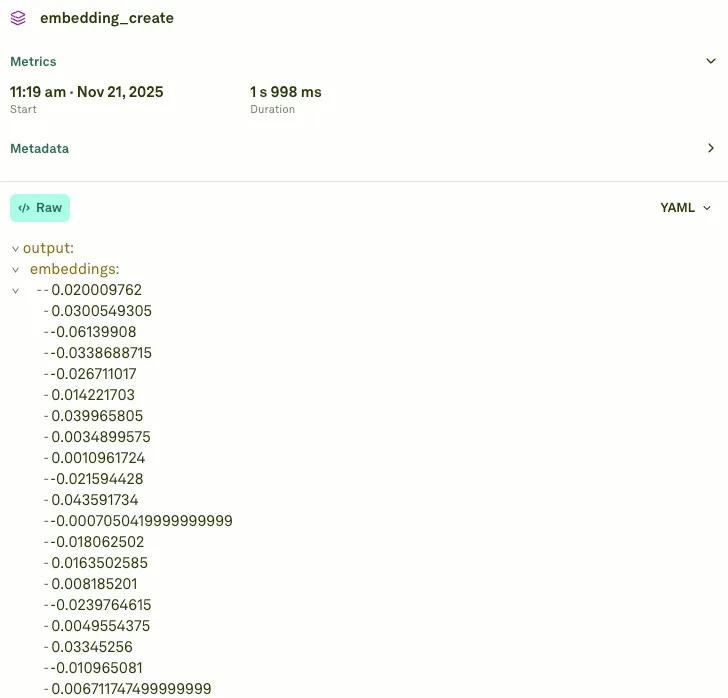
When the app creates an embedding, it adds a span to the trace. The span adds the cost, the token count. It also carries the mathematical details that define the vector itself. See the image below.
addSpan(trace, {
  name: ‘embedding_create’,
  status: ‘success’,
  startedAt: startTime,
  endedAt: endTime,
  content: {
    type: ‘Embeddings’,
    input: { model: ‘text-embedding-3-small’, texts: [text], estimatedTokens },
    output: { embeddings: [finalEmb], dimensions: 1024, vectorNorm: Math.sqrt(finalEmb.reduce((sum, val) => sum + val * val, 0)) }
  },
  latency: endTime - startTime,
  cost: (estimatedTokens / 1000) * 0.00002
});
So, essentially, each span becomes like a small window into the RAG system. This becomes very handy when traffic grows to thousands of queries per hour. It allows you to understand the cost of every choice, down to a fraction of a cent.
Cross-Provider Observability in Action
A good RAG system moves across providers without losing its sense of direction. It may embed with OpenAI, retrieve with Pinecone, and complete with Anthropic. Each part has its own rhythm. Each part has its own failure modes.
The Running Coach App treats every step the same way. An embedding span sits beside a retrieval span. A prompt-augmentation span sits beside a model-completion span. The parent-child relationship between them shows the full flow of the pipeline. You can see the query leave the user’s hands. You can see it move through embeddings. You can see it search the vector store. And you can see it reach the reasoning model that forms the final answer.
At the end of the request, the app submits the full trace. It maps every span into a simple structure. It records the timing. It records the cost. It records the inputs and the outputs.
================================

📊 Pipeline Metrics:
   Embedding Cost:  $0.000011
   LLM Cost:        $0.000757
   ─────────────────────────────
   Total Cost:      $0.000768
   Total Latency:   15418ms
   Spans Executed:  7

Submitting trace to Adaline...
Trace submitted successfully to Adaline.
Then it sends everything to the observability dashboard.
export async function submitTrace(trace: Trace): Promise<void> {
  trace.endedAt = Date.now();
  const spansPayload = trace.spans.map((s) => ({
    startedAt: s.startedAt,
    endedAt: s.endedAt,
    name: s.name,
    status: s.status === ‘success’ ? ‘success’ : ‘failure’,
    content: {
      type: s.content.type,
      input: JSON.stringify(s.content.input),
      output: JSON.stringify(s.content.output)
    },
    parentReferenceId: s.parentReferenceId,
    cost: s.cost,
    latency: s.latency
  }));
  await fetch(`${LOGS_BASE_URL}/trace`, {
    method: ‘POST’,
    headers: { ‘Authorization’: `Bearer ${ADALINE_API_KEY}` },
    body: JSON.stringify({ projectId, trace, spans: spansPayload })
  });
}
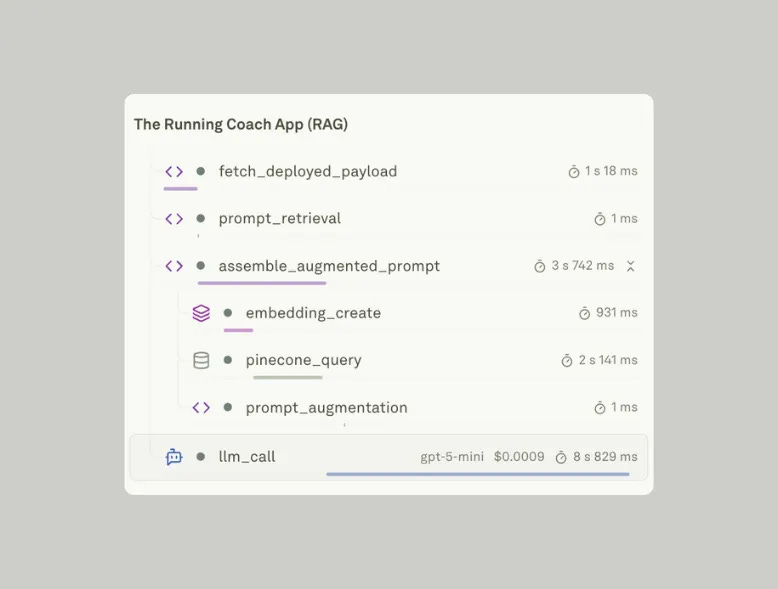
In the dashboard, the trace is rendered as a simple tree. You see OpenAI creating an embedding. You see Pinecone returning results. You see OpenAI or Anthropic models forming the final message. And you see the full cost and latency stitched together into one clear line.
Importance of Observability in Production
A product rarely breaks all at once. Most of the time is a single component.
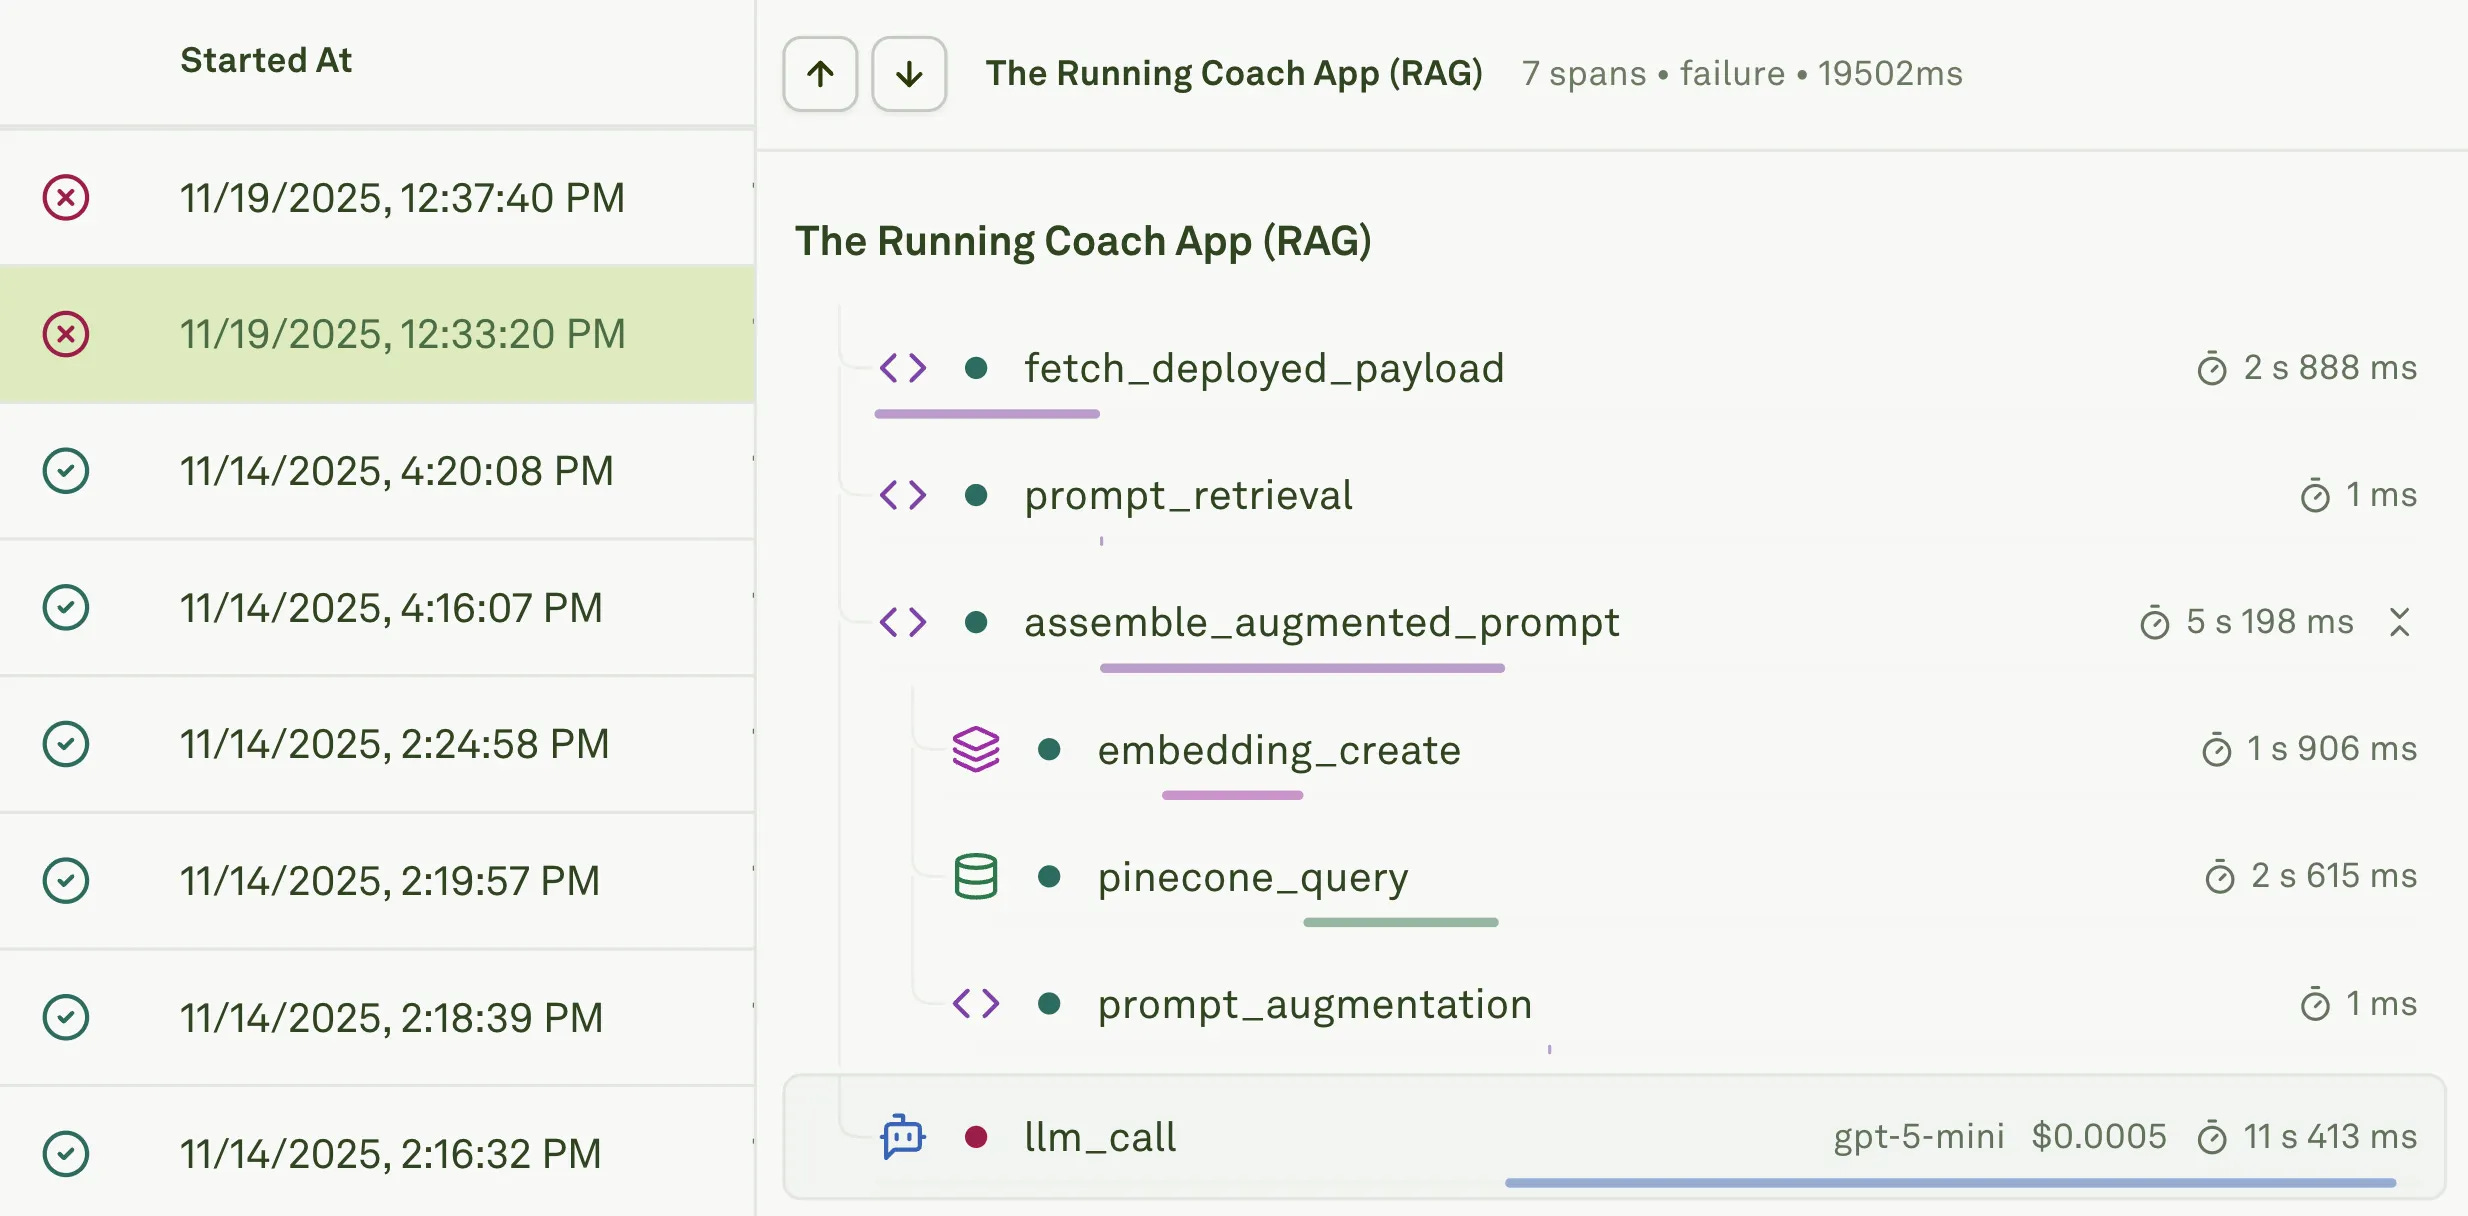
In the example above, you will see that the LLM didn’t complete the response. There are a lot of cases when the response isn’t generated. Sometimes the information retrieval from the vector database times out. Other times the latency is too much.
These are the early signs. And in a production system, you only catch them if you can see the path a query takes. That is where observability becomes more than a tool. It becomes a way to understand how the system behaves under real pressure.
Observability [especially traces and spans] helps you spot which part of the pipeline is slowing down. It shows whether the delay comes from embeddings, retrieval, or the LLM. It also helps you understand how much each step costs. You see the spend per provider. You see the spend per user. You see the spend per query type. This clarity matters when your traffic grows and the cost of a small mistake grows with it.
Observability also gives you flexibility.
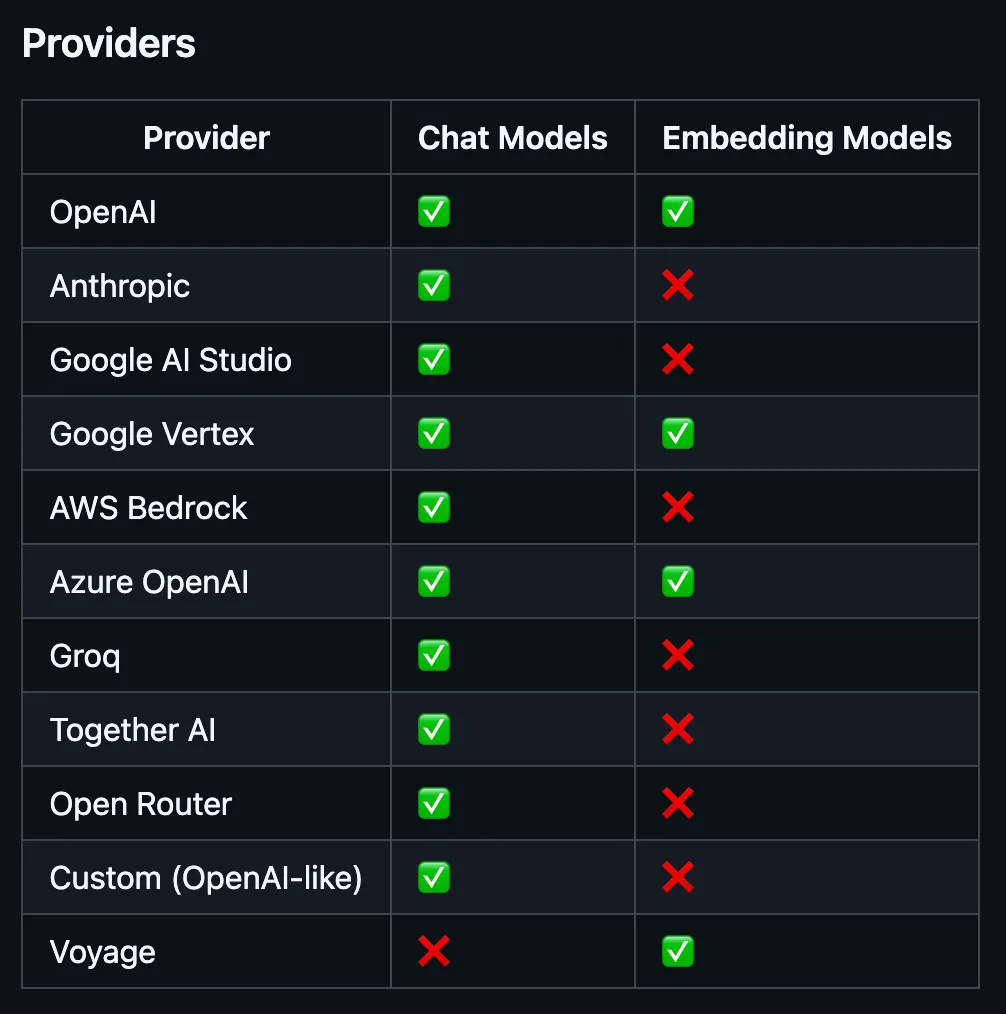
You can move from OpenAI to Google Vertex for embeddings without rebuilding your monitoring. Also, with Adaline Gateway, you can easily standardize model calling. You don’t have to change much when it comes to trying different embedding models.
The spans stay the same. The traces stay the same. The system keeps its shape even when the components change. And it keeps the full team aligned. Product sees latency. Finance sees cost. Engineers see errors and payloads.
Please read more on LLM observability in this blog below:
